White Paper | March 2026
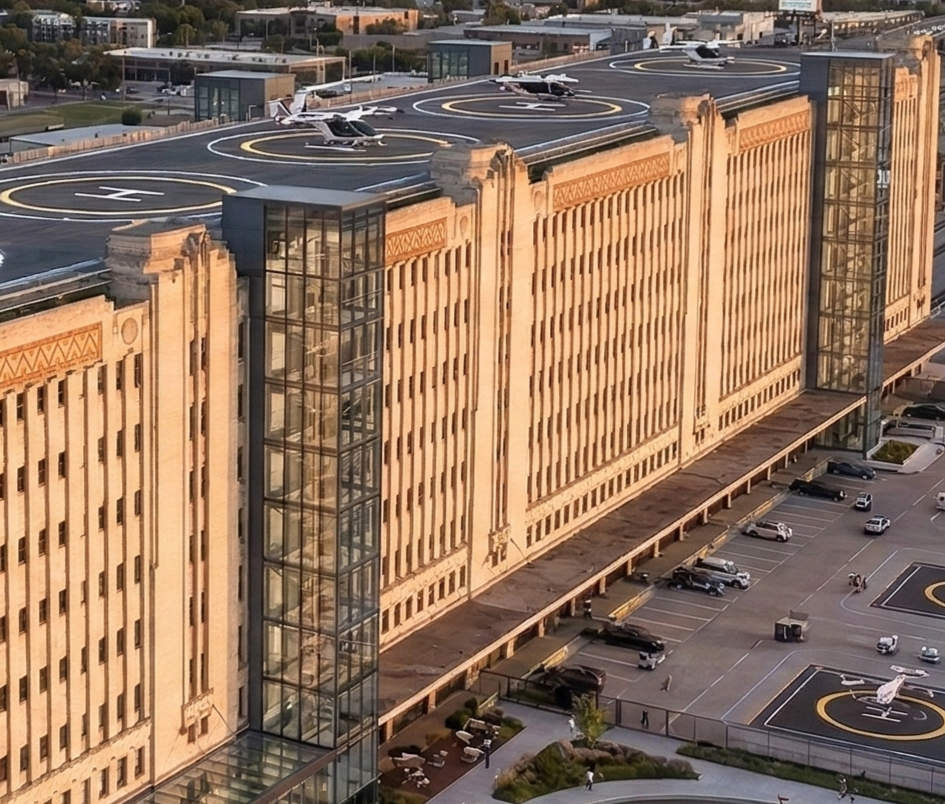
Trinity Air Link
Transportation System
Capital-Light eVTOL + Autonomous Vehicle Infrastructure Platform
A corrected investor-facing white paper for transforming the historic Texas & Pacific Warehouse in Fort Worth into a multi-modal transportation infrastructure platform. This version removes legacy target-return language and aligns with the calculated return model.
24.8%Calculated IRR
Before Terminal
$89.7MNPV @ 10%
Before Terminal
36.8%IRR With
Terminal
$107M–$113MCapital-Light
Base Case
Section 1Executive Overview
Trinity Air Link proposes the adaptive reuse of the Texas & Pacific Warehouse in downtown Fort Worth into a multi-modal mobility hub combining eVTOL access infrastructure, autonomous vehicle access infrastructure, passenger processing, charging/energy services, dispatch software, data services, and an innovation center.
The preferred structure is capital-light and operator-neutral. Certified eVTOL and qualified autonomous vehicle operators carry vehicle acquisition, maintenance, pilots or autonomy operations, insurance, and fleet financing. Trinity Air Link controls and monetizes the infrastructure layer.
$133.4MYear 5 Revenue · Moderate
$44.9MYear 5 EBITDA · Moderate
34%Year 5 EBITDA Margin
$480MModerate Terminal Value
Model discipline: The base case return is calculated before terminal value. Terminal value is shown separately as exit/refinance upside and is not counted as Year 5 operating cash flow.
Section 2The Infrastructure Model
| Layer | Trinity Air Link Role | Operator Role |
|---|
| Air Mobility | Vertiport access, pad scheduling, passenger processing, charging, data, dispatch | Aircraft, pilots, maintenance, insurance, certification, operations |
| Ground Mobility | AV bays, curb management, charging, routing API, facility access, data services | Vehicles, autonomy stack, maintenance, insurance, fleet financing |
| Innovation Center | Leasable R&D space, public showcase, partner ecosystem | Tenant operations, technology deployment, R&D collaboration |
This framing keeps the business closer to transportation infrastructure and platform economics than to an airline, taxi fleet, or aircraft leasing company.
Section 4Capital Plan
| Case | Total Capital | Role in Model |
|---|
| Capital-Light Operator Access | $107M–$113M | Preferred base case; operators carry vehicle capex |
| Hybrid | $115M–$121M | Limited seed/demo fleet exposure |
| Owned-Fleet | $129M | Upside/control case; higher fleet exposure |
Section 5Risk Posture
The capital-light model reduces direct fleet ownership risk, depreciation risk, maintenance burden, certification exposure, and balance-sheet drag. The main risks become adoption rate, operator agreement quality, construction cost control, regulatory timing, and energy/service-level management.
- Terminal value is not blended into operating performance.
- Owned-fleet economics remain a stress/control case rather than launch baseline.
- Revenue is diversified across air mobility, ground mobility, real estate, technology/data, and ancillary services.
- The model should be validated against final operator agreements, energy contracts, debt structure, lease terms, and adoption rates.
Section 6Conclusion
Trinity Air Link is strongest when presented as infrastructure: a scarce, multi-operator mobility node in a fast-growing metro market. The corrected model leads with a defensible 24.8% calculated IRR before terminal value and $89.7M NPV @ 10%, then presents terminal value separately as upside.