← Trinity Air Link
Trinity Air Link Transportation System
Confidential — March 2026

Financial Model &
Investment Analysis

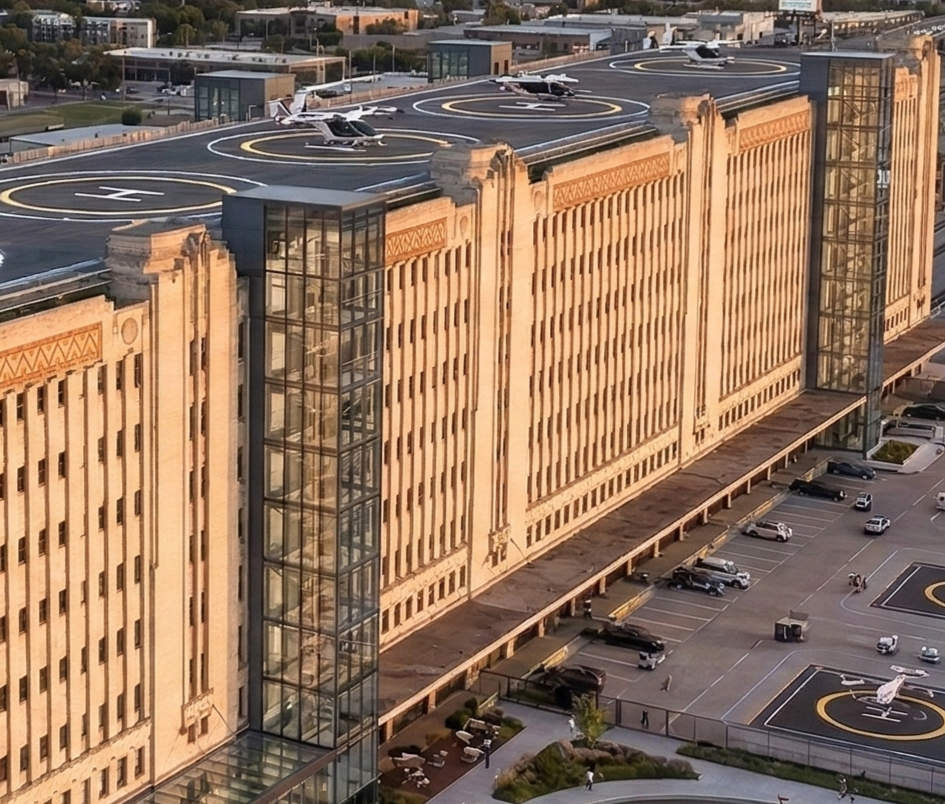
Trinity Air Link Transportation System | T&P Warehouse, Fort Worth, Texas

Calculated financial projections, capital framing, revenue scenarios, and return analysis for a capital-light multi-operator eVTOL and autonomous vehicle infrastructure platform.

24.8%Calculated IRR
Before Terminal
$89.7MNPV @ 10%
Before Terminal
36.8%IRR With
Terminal
$293.2MNPV With
Terminal
$107M–$113MCapital-Light
Base Case
TRINITY AIR LINKFinancial Model & Investment Analysis · March 2026
Section 01 · Investment Overview

Total Capital Requirements

Phase 1
2026 — Foundation
$15M–$25M
Planning, regulatory approvals, design, utility studies, team building, FAA/TXDOT pathway, partner MOUs, early operating burn
Phase 2
2027 — Selective Activation
$40M–$60M
Historic rehabilitation, selective interior activation, rooftop vertiport package, AV terminal, charging, core building systems
Phase 3
2028 — Systems & Deployment
$10M–$32M
Operator access infrastructure, charging/energy systems, dispatch software, technology integration, commissioning, optional seed fleet
Phase 4
2029 — Launch
$20M–$25M
Commercial launch, operator scale-up, marketing, working capital, route expansion, startup contingency
Preferred Base Case: The capital-light operator access model still targets approximately $107M–$113M, but that number is only credible if the early build is framed as a phased activation strategy, not a full top-to-bottom repositioning of the entire T&P Warehouse in the first wave.

Construction & Infrastructure Cost Stack Framing

ScenarioPlanning RangeWhat It Assumes
Lean / Phased Activation$46M–$78MSelective square footage activation, restrained TI load, smaller rooftop package, limited terminal and charging build.
Flagship Initial Build$67M–$122MSerious activation of a larger area, stronger rooftop package, credible charging/utilities, public-facing passenger environment, deeper technology integration.
Heavy Historic / Full-Scope Exposure$122M+Broader building repositioning, heavier TI scope, larger mobility infrastructure package, larger utility and contingency burden.
Model implication: Lower initial capital cases are only defensible if the square footage activation, TI scope, rooftop scope, charging assumptions, and contingency levels are explicitly limited. The cost stack should be used as the sponsor-level capex check behind any investor-facing phase totals.

Phase 3 Deployment Options

ModelPhase 3 Capital NeedDescription
Capital-Light Operator Access$10M–$16MPreferred base case. Independent operators provide aircraft/vehicles and absorb fleet capex. Trinity controls the infrastructure and platform economics.
Hybrid$18M–$24MLimited seed/demo vehicle exposure where required to prove route economics while operators carry most fleet capex.
Owned Fleet$32MUpside/control case. Trinity purchases or finances the initial fleet, capturing more revenue but assuming more asset, depreciation, maintenance, insurance, and regulatory exposure.
Section 02 · Revenue Model

Revenue Projections — Year 5 (2030)

Revenue StreamConservativeModerateOptimisticBasis / Assumptions
Air Mobility Platform Revenue$21.9M$54.8M$131.4MPad/stand access, passenger facility charges, charging markup, dispatch/data fees, revenue share
Ground Mobility Platform Revenue$16.4M$54.8M$137.3MAV bay/curb access, passenger facility charges, energy services, routing API, data fees, revenue share
Innovation Center / Real Estate$2.4M$3.8M$5.1M120K sq ft, $25–45/sq ft, 80–95% occupancy
Technology Licensing & IP$4.0M$10.0M$16.0MDispatch software, data, consulting, licensing
Ancillary$6.0M$10.0M$16.0MRetail, dining, parking, cargo, services
Total Revenue$50.7M$133.4M$305.8M

Capital-Light EBITDA — Year 5

ScenarioRevenueTotal OpExEBITDAEBITDA Margin
Conservative$50.7M$59.0M($8.3M)-16%
Moderate / Base$133.4M$88.5M$44.9M34%
Optimistic$305.8M$138.0M$167.8M55%
TRINITY AIR LINKFinancial Model & Investment Analysis · March 2026
Section 03 · Investor Returns

Return on Investment Summary

24.8%Calculated Project IRR
Before Terminal
$89.7MNPV @ 10%
Before Terminal
$480MModerate Year 10
Terminal Value
36.8%IRR Including
Terminal Value
$293.2MNPV @ 10%
Including Terminal
Return framing: The preferred capital-light moderate case produces a calculated 24.8% 10-year project IRR before terminal value and $89.7M NPV at a 10% discount rate before terminal value. Terminal value is shown separately as exit/refinance upside and is not counted as Year 5 operating cash flow.

10-Year Capital-Light Project Cash Flow — Moderate Base Case Before Terminal Value

YearDevelopment PhaseNet Project Cash FlowNotes
2026Phase 1($25M)Planning, regulatory, team, early operating burn
2027Phase 2($55M)Selective activation and infrastructure development
2028Phase 3($17M)Capital-light technology systems, charging, dispatch, operator access infrastructure
2029Phase 4($2M)Launch year with major revenue ramp
2030Year 5$40MBreakeven / positive annual cash-flow target
2031Stabilization$50MOperator agreements mature
2032Stabilization$55MRoute expansion and higher utilization
2033Stabilization$60MPlatform revenue growth
2034Stabilization$65MMature multi-operator network
2035Stabilization / Exit$70MFinal projected annual cash flow before terminal value

Calculated Return Summary

ScenarioIRR Before TerminalNPV @ 10% Before TerminalTerminal ValueIRR With TerminalNPV With Terminal
Capital-Light Conservative5.0%($23.9M)$210M18.3%$65.2M
Capital-Light Moderate / Base24.8%$89.7M$480M36.8%$293.2M
Capital-Light Optimistic55.7%$440.3M$1.0B62.8%$864.4M
Owned-Fleet Low-Demand Stress(17.2%)($139.6M)$175M2.3%($65.4M)

Terminal Value / Exit Upside

CaseYear 10 EBITDAExit MultipleTerminal Value
Conservative$35M6.0x$210M
Moderate$60M8.0x$480M
Optimistic$100M10.0x$1.0B
Section 04 · Funding Strategy

Capital Structure and Funding Strategy

CaseTotal CapitalUse
Capital-Light Operator Access Case$107M–$113MPreferred base case; operators carry vehicle capex
Hybrid Case$115M–$121MLimited seed/demo fleet exposure
Owned-Fleet Case$129MUpside/control case; higher fleet exposure
Phase 1 Funding Target$20MPlanning, regulatory, design, team, partner MOUs

Exit Strategies

  • Strategic acquisition by airline, automotive, infrastructure, or technology platform
  • Infrastructure recapitalization after stabilized operations
  • REIT-like asset monetization for income-generating real estate/platform assets
  • Municipal partnership buyout with ongoing management contract
  • Franchise/licensing expansion to other metropolitan markets

Government Incentives Available

  • Federal Historic Tax Credits
  • Texas Enterprise Fund and local economic development incentives
  • USDOT/DOE/FAA competitive grant programs as eligible
  • City of Fort Worth public-private partnership tools
  • New Markets Tax Credits where eligible

Investment Inquiries

Trinity Air Link Transportation System · Fort Worth, Texas
All financial outputs are scenario-based planning estimates and depend on certification timelines, adoption rates, partner terms, financing conditions, and the ultimate square footage / infrastructure activation scope.